Example Calculation of Overall Equipment Effectiveness (OEE)
How to Calculate OEE? - Explained with Storytelling
Affiliate Disclosure: Handy Tool Adviser is reader-supported. When you buy through links on our site, we may earn an affiliate commission at no cost to you. Read more about our affiliate association here.
Overall Equipment Effectiveness (OEE) is a metric used by industrial facilities to ascertain the ‘effectiveness’ of their equipment. It serves as an accountability metric for maintenance departments because it gives a high value only if equipment does not experience breakdowns frequently.
We have a dedicated article on explaining Overall Equipment Effectiveness (OEE) in simple English that is easily understandable even for laymen. This article is based on giving an example calculation of Overall Equipment Effectiveness (OEE) so that you may learn how to apply it in your application.
We will present the example in a story-telling way to make it easy to understand by fitting it inside a scenario instead of giving bland math to our readers. This examples will not only teach you how to run the numbers but give you a sense of the ‘why’ of calculating Overall Equipment Effectiveness (OEE).
The name of persons, locations and companies in below example is hypothetical.
Facility Manager Caught in a Dilemma
Michelle is a facility manager in Comfort-Inn Ltd – a big name in hoteling industry. Among her responsibilities includes ensuring that the three air-cooled chillers installed in the basement of their largest hotel based in McAllen are maintained at the highest standards.
The executive management of her company is not satisfied with the performance of the maintenance team with regards to the HVAC system because each summer season, some breakdowns do occur in the three chillers and there are some complaints by hotel residents regarding air conditioning. The executive management always brings it up in every meeting and Michelle is unable to give any satisfactory answer.
When Michelle conveys the same to her maintenance team, they react by saying that the management never acknowledges the great job that they are doing. The maintenance supervisor is an experienced employee of the company and he says it is normal for chillers to experience some breakdowns and that it is not any shortcoming of the maintenance team. Maintenance team also says that nobody is ever fully satisfied with the airconditioning and that is not the fault of maintenance team.
Michelle is worried because she is neither able to defend her maintenance team in front of the executive management nor is she able to convince her maintenance team to do a better job. A friend from another company suggested Michelle to use Overall Equipment Effectiveness (OEE) as a metric to measure the ‘effectiveness’ of her chillers and compare it with benchmarks obtained from other industries.
The metric will give an idea of whether her executive management is right or the maintenance team and whether Michelle needs to defend her maintenance team on the meeting table or convince the maintenance team that they are lagging behind.
Equations for Overall Equipment Effectiveness (OEE)
Michelle learned that Overall Equipment
Effectiveness (OEE) is calculated as,
OEE (%) = Availability (%) x Performance (%) x Quality Rate (%)
Where,
Digging Up Old Records – The Hard Part of Calculating OEE
While Michelle thought it would be easy to simply plug in the values in the above equations and get the result of Overall Equipment Effectiveness (OEE), she soon realized she does not have the values at hand.
She also realized she will have to determine a time period for which Overall Equipment Effectiveness (OEE) is calculated like 3 months or 6 months or a year. Since HVAC equipment experience peak operation in summer season, she decided she is going to calculate Overall Equipment Effectiveness (OEE) for 6 months of summer.
She also realized that she’ll have to calculate the Overall Equipment Effectiveness (OEE) of each of the three chillers separately because Overall Equipment Effectiveness (OEE) is calculated for individual equipment and not a group.
So, Michelle decided to pull last year’s maintenance records from March to August (6 months) for Chiller no. 01, 02 and 03 of her hotel.
Calculating Availability (%)
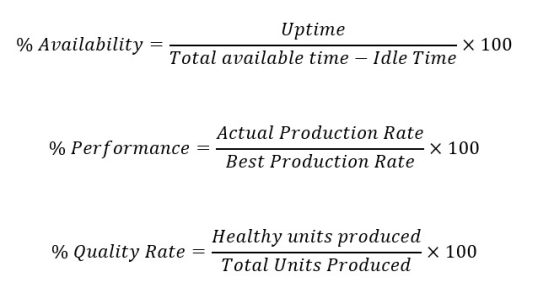
The first thing Michelle needed to calculate was Availability (%) expressed as:
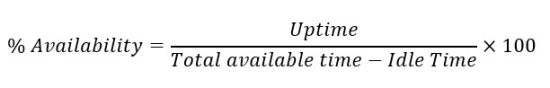
The total available time is the time in which an equipment “can” run. Since chillers can run on 24/7 basis year round, the total available time for each of the three chillers for the selected period of 6 months turned out to be,
Total Available Time (for each of the 3 chillers) = 24 hours/day x 180 days = 4,320 hours
Next, the idle time is the time in which the equipment was ready for service but there was not demand for running it. Michelle noted that Chiller No. 01 and 02 were kept running for the entire 6-month period but Chiller No. 03 was turned on for 12 hours each day (in the mornings) in the entire 6-month period.
It meant that Chiller No. 01 and 02 had no idle time but Chiller No. 03 had 12 hours of idle time per day. Michelle calculated,
Idle Time (for Chiller No. 01 & 02) = 0 hours
Idle Time (for Chiller No. 03) = 12 hours/day x 180 days = 2,160 hours
Finally, it was uptime that Michelle had to calculate which caused the most struggle. Michelle realized that no one records how much time the equipment remained up. It is a no brainer. People record stuff when something goes wrong.
Therefore, she had to calculate the Uptime indirectly as none of the logbooks as well as the computerized record had any value for uptime of each of the chillers.
So, Michelle checked the records for all the downtimes recorded for schedule maintenance, breakdown maintenance and corrective maintenance on each of the three chillers.
Michelle had to go through the entire record of 6-months for each of the three chillers and note down the downtime for each week. She then summed up all the downtime hours for each of the three chillers to get their cumulative downtime hours in the 6-month period. She found,
Chiller No. 01 Total Downtime (in 6-month period) = 25 hours
Chiller No. 02 Total Downtime (in 6-month period) = 73 hours
Chiller No. 03 Total Downtime (in 6-month period) = 11 hours
Now, uptime was to be calculated as,
Uptime = Total Available Time – (Idle Time + Downtime)
Michelle calculated the uptime for each of the three chillers (for the 6-month reference period) as under,
Chiller No. 01 Uptime = 4,320 hours – (0 hours + 25 hours) = 4,295 hours
Chiller No. 02 Uptime = 4,320 hours – (0 hours + 73 hours) = 4,247 hours
Chiller No. 03 Uptime = 4,320 hours – (2,160 hours + 11 hours) = 2,149 hours
Now it was possible to calculate the Availability (%) for each of the three chillers (for the 6-month period under consideration).
Calculating Performance (%)
The next factor that Michelle had to work out was performance of each of the three chillers expressed as,
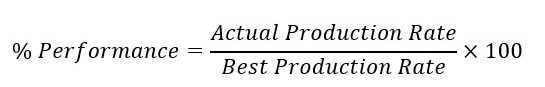
Michelle came across another dilemma. The formula was applicable to a machine that produces some units but what would be the production rate of a Chiller?
Michelle asked herself: what does a chiller produce? – It produces chilled water for the HVAC system of the building. However, nobody records how much quantity of water did each of the chillers cooled down in a day.
So, what’s the alternative?
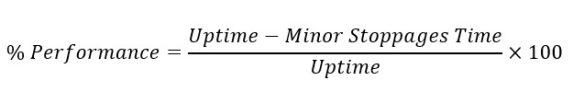
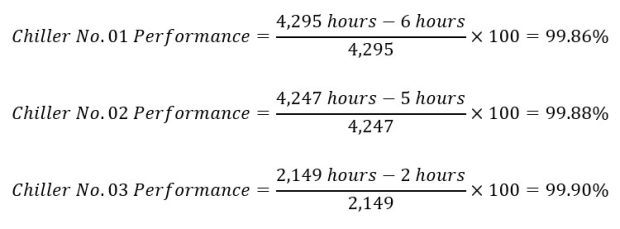
The alternative is that performance is also defined in terms of minor stoppages a piece of equipment encountered such that,
Michelle checked the historical records of each of the three chillers again and noted all the occurrences in which chillers went into an error state that was quickly rectified by the maintenance team.
She summed up all such occurrences for each chiller (in the 6-month period under consideration) and found that,
Minor stoppages experienced in Chiller No. 01 = 6 hours
Minor stoppages experienced in Chiller No. 02 = 5 hours
Minor stoppages experienced in Chiller No. 03 = 2 hours
The performance (%) of each of the chillers was worked out to be,
Calculating Quality Rate (%)
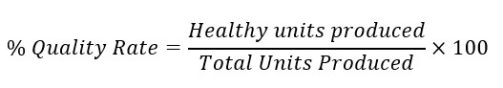
Finally, Michelle had to calculate the quality rate of the each of the three chillers. It is expressed as,
Just like Michelle faced a dilemma in calculating the performance (%) of her chillers, she came across similar problem in quality rate.
Since chillers don’t produce units in which individual units could be identified as defective and healthy, Michelle thought how she could determine the quality rate of the chillers.
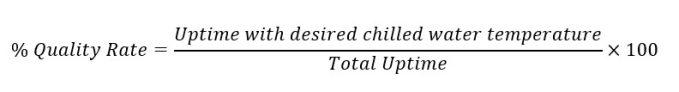
Chillers produce chilled water that circulates in the building to provide air conditioning. From the perspective of a chiller, defective product would be if the chilled water is not of the desired temperature.
Michelle dived into the records again to find instances where operations team recorded complaints of chilled water not meeting the desired temperature. She summed up all such instances to calculate an approximate total time in which each of the three chillers produced defective water.
She calculated the time in which ‘healthy’ water was produced as under,
Uptime in which desired temperature water was produced =
Uptime – Operating Time in which desired chilled water temperature not achieved
She found the values for chillers as under,
Chiller No. 01 = 4,000 hours
Chiller No. 02 = 3,990 hours
Chiller No. 03 = 2,000 hours
Michelle considered the following formula to work out the quality rate of her chillers,
Michelle calculated quality rate of each of her chillers as under,
The Moment of Eureka
Michelle had now done all the hard work involved in computing each of the components of Overall Equipment Effectiveness (OEE) expressed as,
OEE (%) = Availability (%) x Performance (%) x Quality Rate (%)
She calculated the Overall Equipment Effectiveness (OEE) of her chillers as under,
Chiller No. 01 OEE = 99.42% x 99.86% x 93.13% = 92.46%
Chiller No. 02 OEE = 98.31% x 99.88% x 93.94% = 92.24%
Chiller No. 03 OEE = 99.49% x 99.90% x 93.06% = 92.49%
The Moment of Truth
Now, Michelle had calculated the Overall Equipment Effectiveness (OEE) for all three chillers in her facility. However, the original reason for trying to find it in the first place was not for the sake of just running the numbers.
She wanted to find whether her executive management was on the right side or her maintenance team. Therefore, the OEE values alone were not that meaningful for Michelle. She wanted to get some benchmark values to compare her values with.
She approached her connections in the industry and requested for sharing the Overall Equipment Effectiveness (OEE) of chillers in their respective facilities. After a lot of phone calls and emails, she managed to get replies from multiple sources.
She found that the best OEE for chillers was 95% while the lowest was 70%. At this stage, Michelle was able to interpret the OEE’s calculated for her chillers i.e., they weren't doing bad. They were effective equipment for the company.
She now had a clear picture of how to track the effectiveness of her chillers, what to say to the executive management and what to say to the maintenance team.
Michelle also implemented new record and documentation formats to allow her to easily calculate Overall Equipment Effectiveness (OEE) the next time.
Takeaways
- The formulas of Overall Equipment Effectiveness (OEE) and its components are developed from a production perspective. In other industries and equipment types, equivalent metrics will have to be developed.
- The real work in evaluating Overall Equipment Effectiveness (OEE) is not in the application of mathematical expressions. It is in going through data to find the right values to be plugged into the formulas.
- Overall Equipment Effectiveness (OEE) is a pain to calculate for the first time only. After that, it is just a matter of maintaining the right data and tracking improvement.
Other Articles You May Like

brizy_dc_post_title
Learn about Autonomous Maintenance - part of Total Productive Maintenance that empowers machine operators in basic maintenance tasks.

brizy_dc_post_title
Learn what is RAMS - acronym of Reliability, Availability, Maintainability & Safety/Supportability - in industrial maintenance.

brizy_dc_post_title
We explain what is the supposed role of Maintenance Planning Department in industry. We clear misconceptions and give do's and don'ts.

brizy_dc_post_title
Explaining 6 industrial maintenance types: Preventive, Reactive, Corrective, Predictive, Proactive and Reliability Centered Maintenance.
brizy_dc_post_title
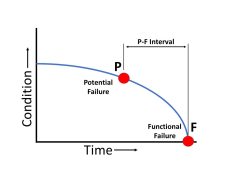
Practical aspects of PF Curve and PF Interval in maintenance & reliability explained. Learn what's the most important question in PF interval?

brizy_dc_post_title
The practical application of ABC classification of inventory for maintenance spare parts with examples from different industries.

brizy_dc_post_title
We explain the concept of Inherent Reliability - A metric used in industrial maintenance and reliability management.
brizy_dc_post_title
Intuitive explanation of Achieved Availability - Metric used in Industrial Maintenance & Reliability Management.

brizy_dc_post_title
Explaining in simple English the term Mean Time To Repair or Replace (MTTR) used in maintenance management.

brizy_dc_post_title
We explain the terms Mean Time Between Failures (MTBF) and Mean Time To Failure (MTTF) in simple and practical language.

brizy_dc_post_title
We give a detailed example of calculating Overall Equipment Effectiveness (OEE) for HVAC equipment (in a story telling style).

brizy_dc_post_title
Explaining the 8 wastes of lean manufacturing (or lean production) philosophy that are applicable on maintenance management.

brizy_dc_post_title
Intuitive explanation of the difference between Total Effective Equipment Performance (TEEP) & Overall Equipment Effectiveness (OEE).

brizy_dc_post_title
We explain in layman terms what is Overall Equipment Effectiveness (OEE) - a metric maintenance teams aim to maximize in industry.

brizy_dc_post_title
We explain a useful metric that is used by maintenance managers to determine efficiency of their maintenance workforce.

brizy_dc_post_title
We explain the maintenance work order system (or work management system) used by maintenance departments in simple words.