The Practical Aspects of PF Curve and PF Interval in Maintenance & Reliability
The terms ‘PF Curve’ and ‘PF Interval’ are known to anyone who is familiar with the basics of reliability engineering, predictive maintenance and conditioned based maintenance. However, what’s not commonly known are their practical aspects.
While everyone is familiar with what’s PF Interval and how maintenance frequency should fit inside the PF Interval, not many people understand how the PF Interval is found practically and how you go about deciding an action plan from it.
Our today’s article is based on explaining these intricacies of the PF Curve and the PF Interval.
Brief Review of PF Curve & PF Interval
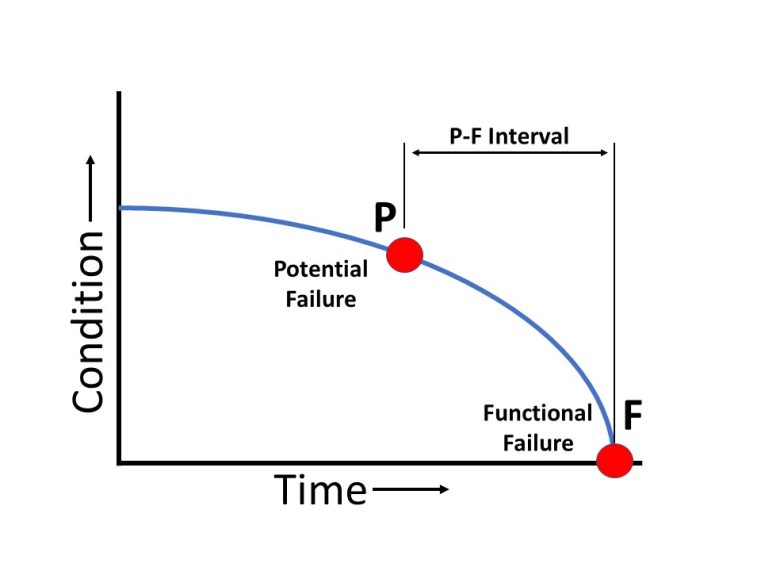
The famous PF curve is represented below:

The P of PF curve refers to the point of potential failure. The F refers to the point of functional failure.
Point of Potential Failure is considered to be the point in time when you detect that the machine is failing. Whereas Functional Failure is when the machine actually fails to perform as per the requirement.
How the Point of Potential Failure can vary greatly for the same system?
The very first question is what is considered the point of potential failure?
Is it the point when you start hearing noise from a bearing? Or is it when the bearing starts producing vibrations?
The answer is that it can be either of those. This is the point where we grapple with the first complexity in this concept.
The point of potential failure is when the first signs of ‘something’s wrong’ is detected in the machine. When that something wrong is detected, that is what’s called the point of potential failure. It can vary based on how the maintenance department is detecting things that are wrong.
Let’s consider the example of an industrial pump being operated and maintained in a facility. In a conventional maintenance department, the point of potential failure would be when the pump operator raises complaint that he can hear abnormal noise from the bearing.
Or maybe during the monthly preventive maintenance, the technician discovers during test run that bearing is giving noise.
Now, let’s consider that the organization that is operating and maintaining the pump is a little advanced and it has implemented a weekly schedule of taking vibration readings of the pumps in its facility.
Now, the bearing is not giving any noise, however, the technician discovers that the vibration readings of the bearing are off. They are not within the normal range. The bearing hasn’t reached the point where it starts giving noise, however, it is not okay anymore.
In the above scenario, the signs of a potential failure have been discovered much earlier than the previous example (when the same was being detected by human senses).
Now let’s say that the maintenance department is highly advanced and it has got live vibration measurement of the bearing in place (instead of a weekly inspection). Now, the moment the vibration readings of the bearing even slightly go off, it will be detected by the central computer system.
In the above scenario, point of potential failure has travelled farther back. Now, even before the vibration goes completely out of range, we have detected that ‘something wrong’ with the bearing.
So, it is clear from the above examples that the point of potential failure on a PF curve can vary from one system to another based on the methods of detection being used by the relevant maintenance department.
The above is just one aspect of how can the point of potential failure be different. There can be other design or environmental factors that could affect the point of potential failure.
How do you find PF Interval? – Easier Said than Done!
Most of the time, the discussions and explanations start from a point where PF Interval is already taken for granted. The discussions generally begin with how to fit maintenance actions within the PF Interval.
What’s missing is that how you find the PF Interval to begin with the whole process?
If you approach the above question from a layman perspective, the answer is simple. Just wait for a potential failure to get converted into a functional failure and record the time. That is your PF Interval.
However, you know it is not practical. You can’t let a machine fail just to find the PF interval.
So, how does it work?
One way the PF interval is found is from the actual data of a potential failure to functional failure. If the maintenance department has historical data regarding a certain functional failures after a certain potential failure, it can be used as reference.
However, out of all the possible failure modes a machine could have, you would never be able to find PF interval for each type.
There can be so many ways a pump could fail. It could fail due to its bearing. It could fail due to impeller issues. It could fail due to motor issues.
So, the other way is to rely on expert judgement of experienced maintenance professionals. You ask the oldest and the most experienced technicians and skilled labor in your department about their opinion on how much time does it take for different potential failures to convert into different functional failure.
For instance, in the example of our pump, you may make a questionnaire regarding potential impeller failures, potential motor failures and potential coupling failures etc.
You are supposed to take as many inputs as possible and compile the results.
PF Curve & Interval is applicable to only a minority of failure modes
The continuation of the above process for finding the PF intervals will result in a
In most of the cases, the opinions of the experienced persons would vary greatly. Such cases will not be considered for applying the concept of PF curve and PF interval.
The PF curve and interval will be applied to only such cases in which a consensus is found. In other words, the concept of PF curve and interval is applied only to such cases and failure modes where the PF interval is obvious in the light of the judgment of many experienced professionals.
When you scale the above argument, you reach to the conclusion that you will never be able to find the PF Interval and draw PF Curve for all of the different types of failure modes in all of the different types of equipment installed in your plant.
You will be able to apply them only on a small minority of cases. Therefore, the maintenance actions to be taken based on PF interval and curve will definitely be limited to only such cases where a PF curve and interval have been confidently ascertained.
The above is not to say that PF curve and interval is not useful. It is just to make you realize to manage your expectations from the concept.
Final Word
In conclusion, the PF curve is a valuable tool for maintenance professionals to determine the point of potential failure and functional failure in equipment. However, determining the PF interval is not as straightforward as it may seem.
The point of potential failure can vary greatly depending on the methods of detection being used by the maintenance department, as well as other design and environmental factors. Finding the PF interval requires historical data and expert judgement, and it is only applicable to a minority of failure modes.
Despite its limitations, the PF curve and interval can be a useful tool for maintenance departments to prioritize maintenance activities and prevent functional failures.
If you liked this post, please share it with someone who may benefit from it.
Other article suggestions


